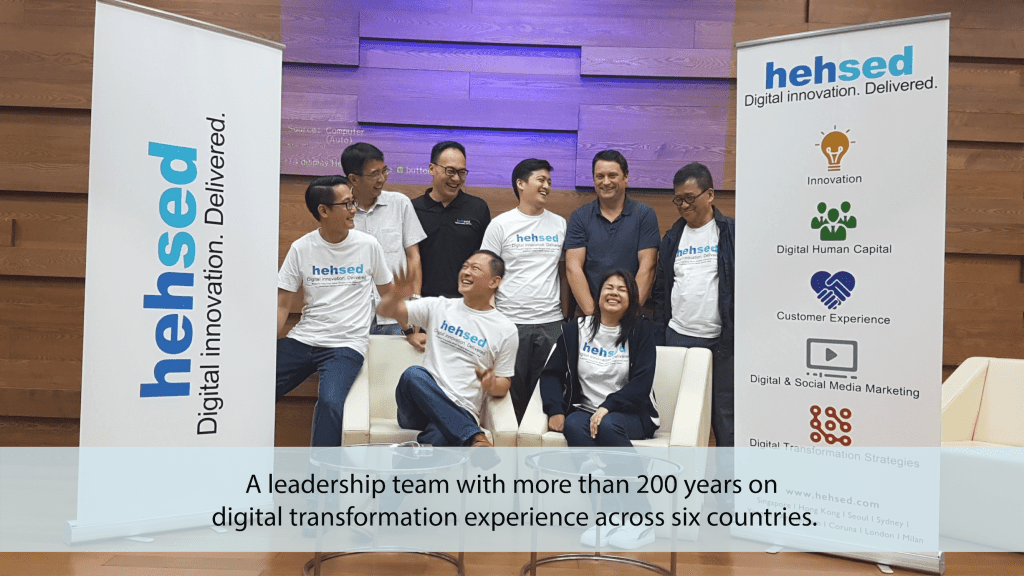
Transforming organisations thru' digital innovation, customer experience & human capital.
Transforming organisations thru' digital innovation, customer experience & human capital.
Transforming organisations thru' digital innovation, customer experience & human capital.
What we do
At Hehsed Consulting, we are dedicated to partnering with you to make your journey to digital transformation and innovation a successful one. We work with you to analyze your situation and propose custom solutions tailored to your needs.
At Hehsed Consulting, we are dedicated to partnering with you to make your journey to digital transformation and innovation a successful one. We work with you to analyze your situation and propose custom solutions tailored to your needs.
Fundamental building blocks for a successful Digital Transformation Journey
Follow in the footsteps of some of our leading clients to help identify the 4 key fundamental building blocks for your Digital Transformation Journey.
Fundamental building blocks for a successful Digital Transformation Journey
Follow in the footsteps of some of our leading clients to help identify the 4 key fundamental building blocks for your Digital Transformation Journey.
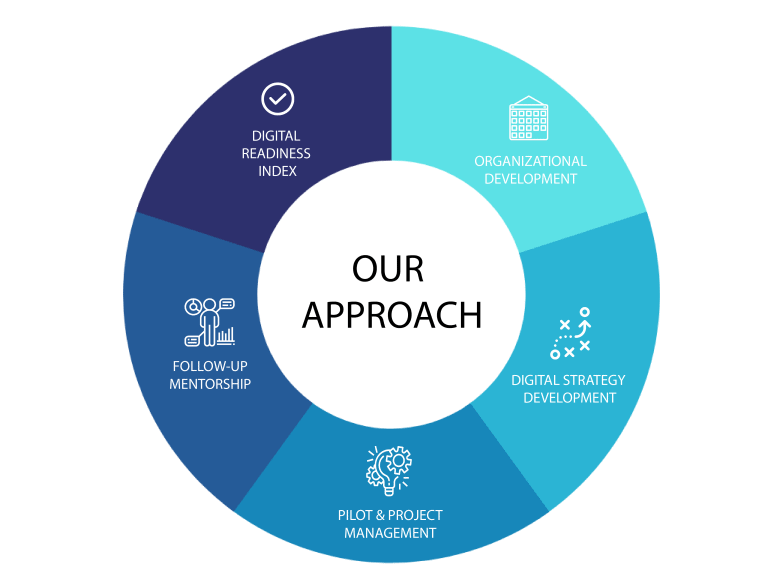
How we can help
At Hehsed, we have our proven 5 step methodology to help businesses and entities discover and evolve sustainably into the new-age digital realm. With our team of expert consultants we help our clients journey through Digital Transformation processes with confidence and ease. We also keep up-to-date with latest digital market environments and challenges for a sustainable business evolution.
At Hehsed, we have our proven 5 step methodology to help businesses and entities discover and evolve sustainably into the new-age digital realm. With our team of expert consultants we help our clients journey through Digital Transformation processes with confidence and ease. We also keep up-to-date with latest digital market environments and challenges for a sustainable business evolution.